The Instrumentation Log window is usually the preferred way to dynamically monitor. your instrumentation output. This window is built into Panorama itself making it easier to use than using an external program like Terminal.app or BBEdit (see Crash Proof Debug Instrumentation Monitoring and Debug Instrumentation Monitoring using an External Program to learn more about using external programs).
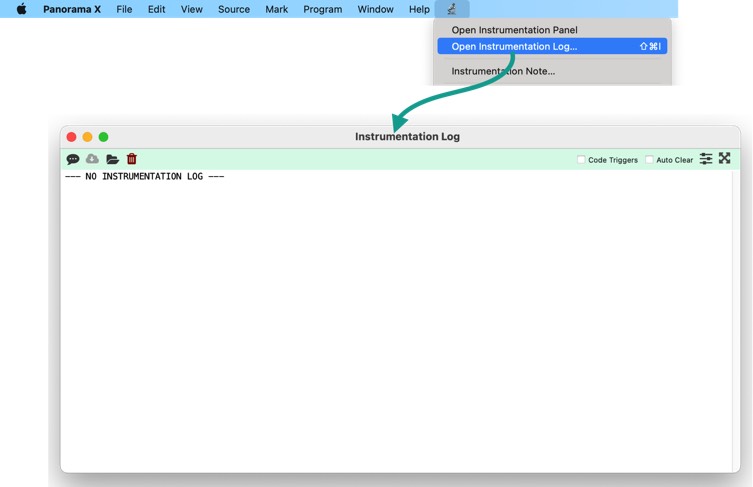
To start using the Instrumentation Log window, simply choose Open Instrumentation Log from the Instrumentation menu. The new window will show recent Panorama instrumentation activity, and will automatically update as new activity occurs.
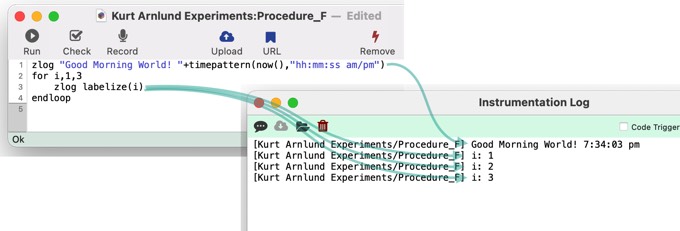
For example, this procedure contains two zlog statements that will output information to the log (the zlog statement is discussed in detail later on this page). If you run this procedure with the Instrumentation Log window open, the information will automatically appear in the log:
The top of the Instrumentation Log window contains a toolbar with common actions:
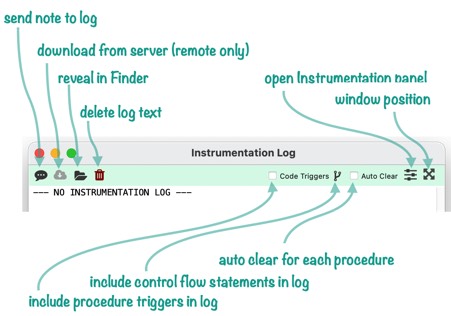
Send Note to Instrumentation Log - Clicking this tool opens a dialog that allows you to send a note to the log. This can be a simple note to yourself, but you can also use this to calculate the result of a formula. See Sending a Note to the Instrumentation Log further down on this page to learn more.
Download from Server - This tool is only available when debugging a web procedure on a remote server. See URL Tool Menu (Web Debugging) to learn more.
Reveal in Finder - Clicking this tool opens a Finder window showing the location of the instrumentation log text file.
Delete Log Text - Click this tool to delete the log and start fresh. Panorama normally asks you to confirm before it does this, but if you right click (or hold down the Control key) it will delete the log without asking (you can also use Command-K to delete the log text without asking). Tip: You can also use the mouse to select part of the log text and delete it using the Edit menu (cut, delete, etc.).
Code Triggers - If this option is enabled, Panorama will automatically add a log entry every time code is triggered. If some code is malfunctioning but you’re not sure where, this helps you to quickly track down what section of code is causing the problem. To learn more about this feature, see Recording Code Triggers in Debug Instrumentation.
Control Flow - This popup menu allows you to record procedure flow as your program calls subroutines and then returns back to main code. See Recording Control Flow in Debug Instrumentation to learn more.
Auto Clear - If this option is enabled, Panorama will automatically clear the log every time a new procedure is started. In other words, each time you press a button, use the Action menu, etc., the log will be cleared. This can be handy for helping you to focus on just the immediate problem without dealing with the clutter of previously run procedures. (On the other hand, sometimes it can be handy to be able to reference logs from procedures that were run earlier.)
Instrumentation Panel - Clicking this tool opens the Instrumentation Panel (in the Preferences window). See Customizing Debug Instrumentation Coverage to learn about the options in this panel.
Window Position - This popup menu allows you to quickly move the log window to different corners of the screen. You’re not limited to the positions in this menu, however, you can drag the position and size of the window anywhere you want at any time.
When you are done with debugging, you can simply close the Instrumentation Log window.
Sending a Note to the Instrumentation Log
The Instrumentation Note dialog provides a way to send an arbitrary message into the instrumentation log. For example, if you are about to start an experiment, you could put a note about it into the log, to help you remember later what you did.
There are three ways to open this dialog:
1) If the Instrumenation Log window is open, simply click on the Note icon (on the far left). 2) Choose Instrumentation Note from the Instrumentation menu in the menu bar (it looks like a magnifying glass). 3) If the Instrumentation preference panel is open, you can also open the note dialog by clicking on the Note icon.)
No matter how you open it, the Note dialog will look like this:
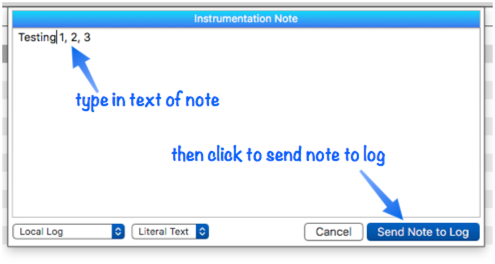
Whatever you type will be sent to the log, with a prefix identifying it as a note, and the current time. It will look something like this:
[NOTE @12:54:34 am] Testing 1, 2, 3
Embedding a Formula in the Note
To embed a formula in the note, enclose the formula in curly braces ({ and }).

Before sending the note to the log, Panorama will calculate the value of the formula and merge it into the note. In this case, the final result looks like this:
[NOTE @12:58:01 am] User is Jim Rea
A second option is to make the entire note a formula.
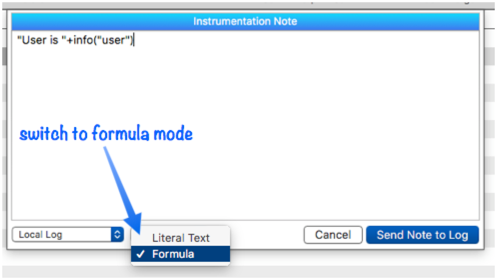
The example above will produce the same log output as the previous example.
Choosing Which Log the Note Appears In
If there is a copy of Panorama X Server running on the current computer, you have a choice of whether to send note to the local log, the server log, or both.

If you send the note to the server, any formula in the note will be calculated on the server. This makes a great investigative tool to poke around and see what is going on on the server. Keep in mind, however, that you have no control over what database is active, or what record and field are active. So you generally don’t want to use database fields in the formula directly. Instead, use formulas with functions that allow you to specify exactly what database, fields, and records you want to investigate, for example info(, dbinfo(, fieldvalue(, fileglobalvalue(, arraybuild(, lookup( etc.
If you choose the Local + Server Log option, any formulas will be calculated twice – once on the local computer, and once on the server. The result of the local calculation will appear in the local log, and the result of the server calculation will appear in the server log. The results won’t necessarily be the same.
To learn more about using Panorama X Server with instrumentation, see Client/Server Debug Instrumentation.
See Also
- Client/Server Debug Instrumentation -- using instrumentation with Panorama X server and clients.
- Coding with Debug Instrumentation -- modifying your code to generate debug instrumentation output.
- Crash Proof Debug Instrumentation Monitoring -- real time crash-proof instrumentation monitoring
- Customizing Debug Instrumentation Coverage -- specifying what code is being debugged at the moment.
- Debug Instrumentation -- conditional logging of the internal state of Panorama program code.
- Debug Instrumentation Monitoring using an External Program -- monitoring debug instrumentation with an external program (Terminal.app, BBEdit.app).
- Debug Instrumentation Text File -- configuring and accessing the debug instrumentation log (text) file.
- info("runningunderterminal") -- returns the name of the terminal program if Panorama was launched under one, otherwise it returns empty text.
- labelize( -- returns the value of a field or variable along with a label. This saves typing when you need to display fields or variables when logging and debugging.
- labelizeformula( -- returns the value of a formula along with the formula itself as a label.
- labelizeinfo( -- returns the value of an info( function, along with the function itself as a label.
- labelizepattern( -- formats a text value using a label and a pattern.
- Recording Code Triggers in Debug Instrumentation -- the code triggers option automatically tracks whenever any code is triggered, whether from a menu, a button, or implicitly (for example when data is entered).
- Recording Control Flow in Debug Instrumentation -- configure debug instrumentation to automatically log when control flow is non-linear, for example a call, return, goto, etc.
- setzlog -- turns instrumentation coverage on or off for a specific procedure (or all procedures within a database).
- zlog -- outputs a message to the instrumentation log (if instrumentation is enabled).
- zlogalways -- unconditionally outputs a message to the instrumentation log.
- zlogcoverage -- allows instrumentation coverage to be turned on or off within a procedure.
- zlogdictionary -- outputs a data dictionary to the instrumentation log (if instrumentation is enabled).
- zlogging( -- returns true if zlogging is enabled for the current database and procedure, otherwise false.
History
| Version | Status | Notes |
| 10.2 | New | New in this version. |